Welcome to the Community View section of the website. This area is dedicated to articles of interest, community information and local topics that are submitted by members of the public or guest writers. It is also the main section dedicated to the Youth Media Group Project.
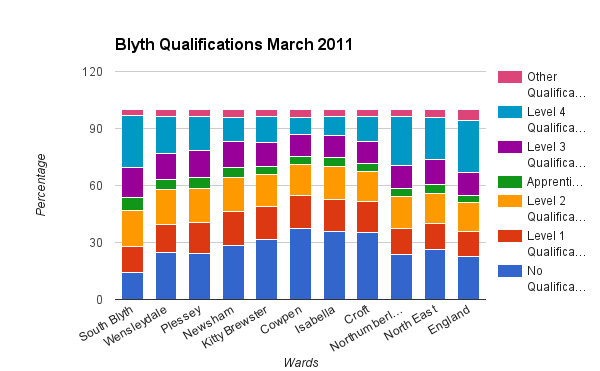
The data for the graphs is derived from the March 2011 census. The graphs compare various topics in the eight administrative wards that comprise Blyth. (A map of the ward boundaries can be found at this link... Ward Map of Blyth)
Blyth is home to 37,339 people in 16,381 households. 376 live in communal establishments. 16,356 people between the age of 16-74 are in employment. (2011 census)
16,452 vehicles are owned (5074 households have no car or van, while 158 have more than four vehicles). (2011 census)
For comparison in Cramlington 45.7% households are not classed as deprived in any way while 0.28 have 4 or more indicators of deprivation. In Blyth the figures are 37.34 not deprived and 0.45 households with 4 or more.
Some select indicators of deprivation and lack of deprivation across the wards including health, employment, education and tenure.
.png)
.png)
This is a similar set of two graphs showing negative and positive indicators for levels of deprivation. This time however the data relates to smaller areas within wards known as Lower Super Output Areas. They usually have a population of around 1000 people. In 2011 there were 32482 LSOAs in England. I have chosen four LSOAs in Blyth to compare: 022C in Croft Ward is the most deprived in Blyth, ranking at 400th out of 32482 deprived nationally on the indices of multiple deprivation (London Tower Hamlets is 405th), while 026C in South Blyth is the least deprived ranking at 27333 nationally. The Cowpen Farm and Isabella LSOAs are included because I have a special interest in them. An LSOA in Blackpool is shown by comparison. Blackpool has a high proportion of areas with high levels of deprivation. 013C is ranked 27th in the indices of multiple deprivation.
In Croft 022C 42.6% of the population have no qualifications down on 53.3% ten years previously in in 2001. In South Blyth this figure is 11.1% down from 15.4 in 2001. There is a similar pattern in Cowpen and Isabella wards with the rate of people with no qualifications down from around 50% to 33% in the ten years to 2011.
Recently released figures have shown that Croft 022C has risen up the table of indices of multiple deprivation from 400th to 650th most deprived. What this can be attributed to is not stated.
1.png)
1.png)
| Managers, Directors and Senior Officials |
| Professional Occupations |
| Associate Professional and Technical Occupations |
| Administrative and Secretarial Occupations |
| Skilled Trades Occupations |
| Caring, Leisure and Other Service Occupations |
| Sales and Customer Service Occupations |
| Process, Plant and Machine Operatives |
| Elementary Occupations |
The average aross the whole of Blyth: professional 9.7%; administrative 13.4%; elementary 12.8%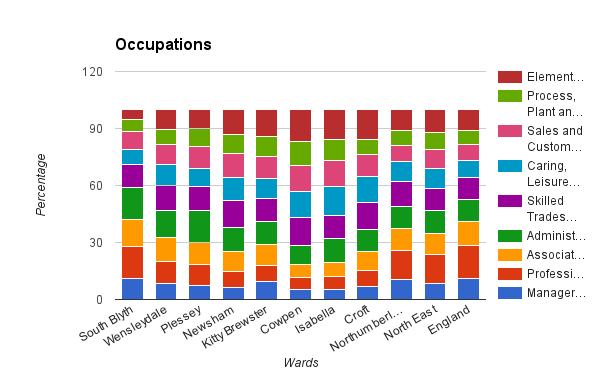
The average across the whole of Blyth: married 45.4%; single (never married) 22.9%; divorced 7.5%
1.png)
The average across the whole of Blyth: no qualifications 28.9%; level 3 qualifications 13.1%
1.png)
1.png)
The average across the whole of Blyth: long-term unemployed 2.5%; never worked 0.94%;
| Unemployed; Age 16 to 24 (blue) |
| Unemployed; Age 50 to 74 (red) |
| Unemployed; Never Worked (yellow) |
| Long-Term Unemployed (green) |
1.png)
The average for households with a mortgage across the whole of Blyth is 34%.
1.png)
.png)